GLORIA RRS data#
https://doi.pangaea.de/10.1594/PANGAEA.948492
A global dataset of remote sensing reflectance and water quality from inland and coastal waters (GLORIA) includes many useful datasets for chlorophyll algorithm development.
First, read in the rrs data and the metadata and append relevant metadata variables
import numpy as np
import pandas as pd
import matplotlib.pyplot as plt
import cartopy
import cartopy.crs as ccrs
import cartopy.feature as cfeature
from cartopy.mpl.gridliner import LONGITUDE_FORMATTER, LATITUDE_FORMATTER
import geopandas as gpd
from datetime import datetime
import os
from matplotlib import ticker
import datetime as dt
import plotly.express as px
import cmocean as cm
import cmocean.cm as cmo
import matplotlib.gridspec as gridspec
import time
import matplotlib.ticker as mticker
gloria_22 = pd.read_csv(r'C:\Users\gianna.milton\Documents\Python\one off cruises\GLORIA-2022\GLORIA_2022\GLORIA_meta_and_lab.csv') #metadata
excel_file = pd.read_csv(r'C:\Users\gianna.milton\Documents\Python\one off cruises\GLORIA-2022\GLORIA_2022\GLORIA_Rrs.csv') #rrs data
excel_file = excel_file.drop('GLORIA_ID', axis=1) #remove duplicate id column to ensure consistannt columns
since gloria_22 and excel_file are the exact same size and have the exact same ID values in the same order, we can drop the ID column in excel_file and just concat the two dataframes
#since gloria_22 has the metadata for excel_file, and they match row wise, just concat
gloria_22 = pd.concat([gloria_22, excel_file],axis=1)
gloria_22 = gloria_22.dropna(axis=1, how='all')

columns_no=['GLORIA_ID', 'LIMNADES_ID', 'Data_collection_purpose','Sample_ID', 'Special_event_flag', 'Site_name', 'Country',
             'Country_code', 'Platform','Water_body_type', 'Water_type', 'Elevation_asl', 'Wave_height', 'Wind_speed', 'Cloud_fraction', 'Distance_from_platform',
             'Platform_length', 'Platform_height', 'Distance_to_shore', 'Landcover', 'Topography','Distance_to_river_discharge',
             'Optical_stability_of_water', 'Instrument_manufacturer', 'Instrument_model', 'Last_calibration', 'Measurement_method', 'Lt_nadir',
             'Lt_relative_azimuth', 'Lsky_zenith','Lsky_relative_azimuth', 'Spectral_resolution', 'Number_of_radiometers','Field_of_view_Lt_radiometer',
             'Field_of_view_Lu_radiometer', 'Skyglint_removal', 'Bias_removal_in_NIR', 'Self_shading_correction','Viewing_angle_correction',
             'Availability_of_IOPs', 'Sample_depth', 'Water_collection_equipment', 'Chl_method', 'Phaeophytin_correction', 'TSS_method',
             'aCDOM_method', 'Chla', 'Chla_plus_phaeo', 'TSS','aCDOM440', 'Turbidity', 'Secchi_depth', 'Comments']
gloria_22 = gloria_22.drop(columns_no, axis=1)

#rename columns
gloria_22 = gloria_22.rename(columns={'Organization_ID':'affiliations','Dataset_ID':'experiment','Latitude':'lat','Longitude':'lon','Date_Time_UTC':'datetime',
                                  'Depth':'depth','SeaBASS_ID':'DOI_url'})
All of GLORIA’s rrs columns are in the format rrs_wavelength (rrs_400, rrs_500, ect). So turn these into a single wavelength column and a single rrs column to best match the seabass one.
#turn rrs into same format as seabass
rrs_cols = [col for col in gloria_22.columns if col.startswith('Rrs_')]

df_long = gloria_22.melt(id_vars=['affiliations', 'experiment', 'lat', 'lon', 'datetime', 'depth','DOI_url'], value_vars=rrs_cols,var_name='raw_wavelength',  value_name='rrs')
#remove the 'Rrs_' string from the column
df_long['raw_wavelength'] = df_long['raw_wavelength'].str.replace('Rrs_', '')
df_long['wavelength'] = pd.to_numeric(df_long['raw_wavelength'])
df_long = df_long.drop(columns=['raw_wavelength'])
df_long = df_long.dropna(subset=['rrs'])
df_long['source']='GLORIA'
#if DOI_url is empty, refer to the doi of paper 'https://doi.pangaea.de/10.1594/PANGAEA.948492
df_long['DOI_url'] = df_long['DOI_url'].fillna('https://doi.pangaea.de/10.1594/PANGAEA.948492')
#remove any inland data
shp = gpd.read_file(r'C:\Users\gianna.milton\Documents\Python\Shapefiles\combined_coastline.shp')
gdf = gpd.GeoDataFrame(df_long, geometry=gpd.points_from_xy(df_long.lon, df_long.lat), crs="EPSG:4269")
gdf = gdf.to_crs(shp.crs)
df_long = gpd.sjoin(gdf, shp, how="inner", predicate="within")
columns_to_drop = ['geometry', 'index_right', 'merge_id']
df_long = df_long.drop(columns=columns_to_drop)
df_long= df_long.reset_index(drop=True)
df_long = df_long[df_long['datetime'] >= '2000-01-01']
Done!
Plots#
gloria = pd.read_excel(r'C:\Users\gianna.milton\Documents\Python\Coastal_chl_final\GLORIA_rrs_na.xlsx')
---------------------------------------------------------------------------
KeyboardInterrupt                         Traceback (most recent call last)
Cell In[8], line 1
----> 1 gloria = pd.read_excel(r'C:\Users\gianna.milton\Documents\Python\Coastal_chl_final\GLORIA_rrs_na.xlsx')

File ~\AppData\Local\anaconda3\Lib\site-packages\pandas\io\excel\_base.py:508, in read_excel(io, sheet_name, header, names, index_col, usecols, dtype, engine, converters, true_values, false_values, skiprows, nrows, na_values, keep_default_na, na_filter, verbose, parse_dates, date_parser, date_format, thousands, decimal, comment, skipfooter, storage_options, dtype_backend, engine_kwargs)
    502     raise ValueError(
    503         "Engine should not be specified when passing "
    504         "an ExcelFile - ExcelFile already has the engine set"
    505     )
    507 try:
--> 508     data = io.parse(
    509         sheet_name=sheet_name,
    510         header=header,
    511         names=names,
    512         index_col=index_col,
    513         usecols=usecols,
    514         dtype=dtype,
    515         converters=converters,
    516         true_values=true_values,
    517         false_values=false_values,
    518         skiprows=skiprows,
    519         nrows=nrows,
    520         na_values=na_values,
    521         keep_default_na=keep_default_na,
    522         na_filter=na_filter,
    523         verbose=verbose,
    524         parse_dates=parse_dates,
    525         date_parser=date_parser,
    526         date_format=date_format,
    527         thousands=thousands,
    528         decimal=decimal,
    529         comment=comment,
    530         skipfooter=skipfooter,
    531         dtype_backend=dtype_backend,
    532     )
    533 finally:
    534     # make sure to close opened file handles
    535     if should_close:

File ~\AppData\Local\anaconda3\Lib\site-packages\pandas\io\excel\_base.py:1616, in ExcelFile.parse(self, sheet_name, header, names, index_col, usecols, converters, true_values, false_values, skiprows, nrows, na_values, parse_dates, date_parser, date_format, thousands, comment, skipfooter, dtype_backend, **kwds)
   1576 def parse(
   1577     self,
   1578     sheet_name: str | int | list[int] | list[str] | None = 0,
   (...)
   1596     **kwds,
   1597 ) -> DataFrame | dict[str, DataFrame] | dict[int, DataFrame]:
   1598     """
   1599     Parse specified sheet(s) into a DataFrame.
   1600
   (...)
   1614     >>> file.parse()  # doctest: +SKIP
   1615     """
-> 1616     return self._reader.parse(
   1617         sheet_name=sheet_name,
   1618         header=header,
   1619         names=names,
   1620         index_col=index_col,
   1621         usecols=usecols,
   1622         converters=converters,
   1623         true_values=true_values,
   1624         false_values=false_values,
   1625         skiprows=skiprows,
   1626         nrows=nrows,
   1627         na_values=na_values,
   1628         parse_dates=parse_dates,
   1629         date_parser=date_parser,
   1630         date_format=date_format,
   1631         thousands=thousands,
   1632         comment=comment,
   1633         skipfooter=skipfooter,
   1634         dtype_backend=dtype_backend,
   1635         **kwds,
   1636     )

File ~\AppData\Local\anaconda3\Lib\site-packages\pandas\io\excel\_base.py:778, in BaseExcelReader.parse(self, sheet_name, header, names, index_col, usecols, dtype, true_values, false_values, skiprows, nrows, na_values, verbose, parse_dates, date_parser, date_format, thousands, decimal, comment, skipfooter, dtype_backend, **kwds)
    775     sheet = self.get_sheet_by_index(asheetname)
    777 file_rows_needed = self._calc_rows(header, index_col, skiprows, nrows)
--> 778 data = self.get_sheet_data(sheet, file_rows_needed)
    779 if hasattr(sheet, "close"):
    780     # pyxlsb opens two TemporaryFiles
    781     sheet.close()

File ~\AppData\Local\anaconda3\Lib\site-packages\pandas\io\excel\_openpyxl.py:615, in OpenpyxlReader.get_sheet_data(self, sheet, file_rows_needed)
    613 data: list[list[Scalar]] = []
    614 last_row_with_data = -1
--> 615 for row_number, row in enumerate(sheet.rows):
    616     converted_row = [self._convert_cell(cell) for cell in row]
    617     while converted_row and converted_row[-1] == "":
    618         # trim trailing empty elements

File ~\AppData\Local\anaconda3\Lib\site-packages\openpyxl\worksheet\_read_only.py:85, in ReadOnlyWorksheet._cells_by_row(self, min_col, min_row, max_col, max_row, values_only)
     77 with self._get_source() as src:
     78     parser = WorkSheetParser(src,
     79                              self._shared_strings,
     80                              data_only=self.parent.data_only,
     81                              epoch=self.parent.epoch,
     82                              date_formats=self.parent._date_formats,
     83                              timedelta_formats=self.parent._timedelta_formats)
---> 85     for idx, row in parser.parse():
     86         if max_row is not None and idx > max_row:
     87             break

File ~\AppData\Local\anaconda3\Lib\site-packages\openpyxl\worksheet\_reader.py:156, in parse()

File ~\AppData\Local\anaconda3\Lib\xml\etree\ElementTree.py:1238, in iterparse.<locals>.iterator(source)
   1236 yield from pullparser.read_events()
   1237 # load event buffer
-> 1238 data = source.read(16 * 1024)
   1239 if not data:
   1240     break

File ~\AppData\Local\anaconda3\Lib\zipfile\__init__.py:989, in ZipExtFile.read(self, n)
    987 self._offset = 0
    988 while n > 0 and not self._eof:
--> 989     data = self._read1(n)
    990     if n < len(data):
    991         self._readbuffer = data

File ~\AppData\Local\anaconda3\Lib\zipfile\__init__.py:1057, in ZipExtFile._read1(self, n)
   1055     data = self._decompressor.unconsumed_tail
   1056     if n > len(data):
-> 1057         data += self._read2(n - len(data))
   1058 else:
   1059     data = self._read2(n)

File ~\AppData\Local\anaconda3\Lib\zipfile\__init__.py:1089, in ZipExtFile._read2(self, n)
   1086 n = max(n, self.MIN_READ_SIZE)
   1087 n = min(n, self._compress_left)
-> 1089 data = self._fileobj.read(n)
   1090 self._compress_left -= len(data)
   1091 if not data:

File ~\AppData\Local\anaconda3\Lib\zipfile\__init__.py:808, in _SharedFile.read(self, n)
    804     raise ValueError("Can't read from the ZIP file while there "
    805             "is an open writing handle on it. "
    806             "Close the writing handle before trying to read.")
    807 self._file.seek(self._pos)
--> 808 data = self._file.read(n)
    809 self._pos = self._file.tell()
    810 return data

KeyboardInterrupt:
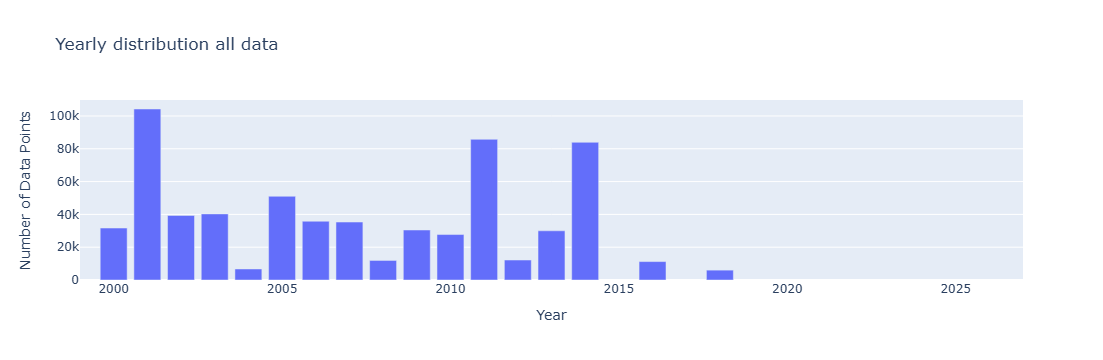
year_test=gloria.copy()
year_test['datetime'] = pd.to_datetime(year_test['datetime'])
year_test['year'] = year_test['datetime'].dt.year
grouped = year_test.groupby(['year']).size().reset_index(name='DataPoints')

# Create bar chart
fig = px.bar(grouped,x='year', y='DataPoints', title='Yearly distribution all data',
             labels={'year': 'Year', 'DataPoints': 'Number of Data Points', 'metadata': 'Metadata'},)
fig.update_xaxes(range=[1999,2027])
fig.update_layout(barmode='stack')  # ensures stacking
fig.show()
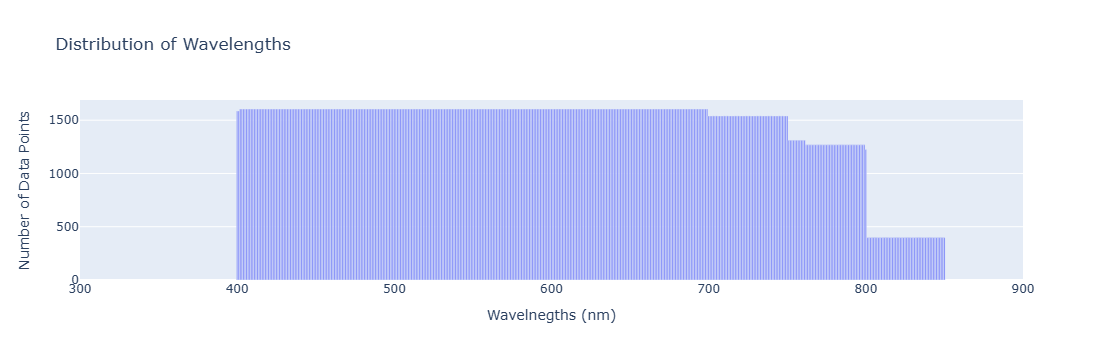
grouped = year_test.groupby(['wavelength']).size().reset_index(name='DataPoints')
# Create bar chart
fig = px.bar(grouped,x='wavelength', y='DataPoints', title='Distribution of Wavelengths',
             labels={'wavelength': 'Wavelnegths (nm)', 'DataPoints': 'Number of Data Points', 'metadata': 'Metadata'},)
fig.update_xaxes(range=[300,900])
fig.update_layout(barmode='stack')  # ensures stacking
fig.show()
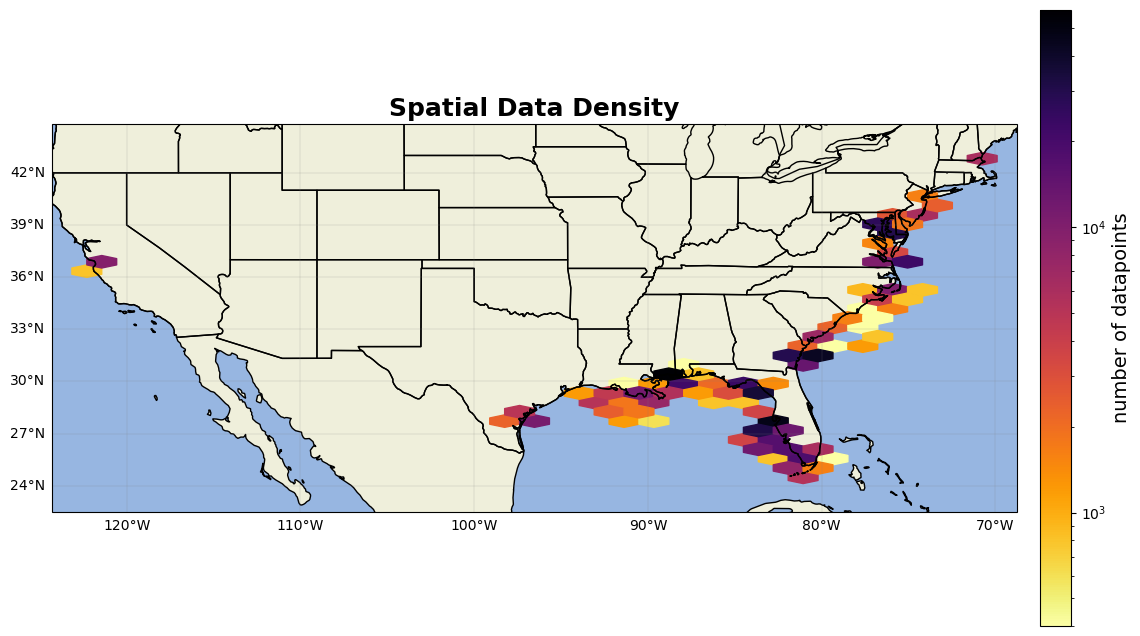
from matplotlib.colors import LogNorm # Important for high-variance data
fig = plt.figure(figsize=(15, 10))
ax = fig.add_subplot(1, 1, 1, projection=ccrs.PlateCarree())
ax.add_feature(cfeature.LAND)
ax.add_feature(cfeature.OCEAN)
ax.add_feature(cfeature.COASTLINE)
ax.add_feature(cfeature.BORDERS)
ax.add_feature(cfeature.STATES)
hb = ax.hexbin(year_test.lon, year_test.lat, gridsize=30, cmap='inferno_r', mincnt=1, transform=ccrs.PlateCarree(),norm=LogNorm())
cb = plt.colorbar(hb, ax=ax, orientation='vertical', pad=0.02, shrink=0.8)
cb.set_label('number of datapoints', fontsize=14)
gl=ax.gridlines(linewidth=0.2,color='grey',alpha=0.7,linestyle='-', draw_labels=True, x_inline= False,y_inline=False)
gl.xformatter=LONGITUDE_FORMATTER
gl.yformatter=LATITUDE_FORMATTER
gl.top_labels = False    # Disable top labels
gl.right_labels = False  # Disable right labels
ax.set_xlim(min(year_test.lon)-2,max(year_test.lon)+2)
ax.set_ylim(min(year_test.lat)-2,max(year_test.lat)+2)
ax.set_title('Spatial Data Density', fontsize=18, fontweight='bold')

plt.show()