Aquamatch Data#
The Aquamatch data is a repository of mostly inland chlorophyll data used for satellite matchup. Similar to data such as CalCOFI and HOTS, this dataset is highly QA/QCd and so it’s easy to go through their documentation and remove any flagged chlorophyll data. Even though the dataset is mostly inland, there is some chlorophyll data in coastal regions.
link to dataset: https://portal.edirepository.org/nis/mapbrowse?packageid=edi.1756.2
link to paper: https://agupubs.onlinelibrary.wiley.com/doi/10.1029/2019WR024883
import numpy as np
import pandas as pd
import matplotlib.pyplot as plt
import cartopy
import cartopy.crs as ccrs
import cartopy.feature as cfeature
from cartopy.mpl.gridliner import LONGITUDE_FORMATTER, LATITUDE_FORMATTER
import geopandas as gpd
from datetime import datetime
import os
from matplotlib import ticker
import datetime as dt
import plotly.express as px
import cmocean as cm
import cmocean.cm as cmo
import matplotlib.gridspec as gridspec
import time
import matplotlib.ticker as mticker
#limit data to just the coastal region
aqua_match1 = pd.read_excel(r'C:\Users\gianna.milton\Documents\Python\one off cruises\AquaMatch_chl.xlsx') #read in datafile

#subset to just the coastal waters
shp1 = gpd.read_file(r'C:\Users\gianna.milton\Documents\Python\Shapefiles\combined_coastline.shp')
gdf1 = gpd.GeoDataFrame(aqua_match1, geometry=gpd.points_from_xy(aqua_match1.lon, aqua_match1.lat), crs="EPSG:4269")
gdf1 = gdf1.to_crs(shp1.crs)
aqua_match1 = gpd.clip(gdf1,shp1)
---------------------------------------------------------------------------
KeyboardInterrupt                         Traceback (most recent call last)
Cell In[2], line 2
      1 #limit data to just the coastal region
----> 2 aqua_match1 = pd.read_excel(r'C:\Users\gianna.milton\Documents\Python\one off cruises\AquaMatch_chl.xlsx') #read in datafile
      4 #subset to just the coastal waters
      5 shp1 = gpd.read_file(r'C:\Users\gianna.milton\Documents\Python\Shapefiles\combined_coastline.shp')

File ~\AppData\Local\anaconda3\Lib\site-packages\pandas\io\excel\_base.py:508, in read_excel(io, sheet_name, header, names, index_col, usecols, dtype, engine, converters, true_values, false_values, skiprows, nrows, na_values, keep_default_na, na_filter, verbose, parse_dates, date_parser, date_format, thousands, decimal, comment, skipfooter, storage_options, dtype_backend, engine_kwargs)
    502     raise ValueError(
    503         "Engine should not be specified when passing "
    504         "an ExcelFile - ExcelFile already has the engine set"
    505     )
    507 try:
--> 508     data = io.parse(
    509         sheet_name=sheet_name,
    510         header=header,
    511         names=names,
    512         index_col=index_col,
    513         usecols=usecols,
    514         dtype=dtype,
    515         converters=converters,
    516         true_values=true_values,
    517         false_values=false_values,
    518         skiprows=skiprows,
    519         nrows=nrows,
    520         na_values=na_values,
    521         keep_default_na=keep_default_na,
    522         na_filter=na_filter,
    523         verbose=verbose,
    524         parse_dates=parse_dates,
    525         date_parser=date_parser,
    526         date_format=date_format,
    527         thousands=thousands,
    528         decimal=decimal,
    529         comment=comment,
    530         skipfooter=skipfooter,
    531         dtype_backend=dtype_backend,
    532     )
    533 finally:
    534     # make sure to close opened file handles
    535     if should_close:

File ~\AppData\Local\anaconda3\Lib\site-packages\pandas\io\excel\_base.py:1616, in ExcelFile.parse(self, sheet_name, header, names, index_col, usecols, converters, true_values, false_values, skiprows, nrows, na_values, parse_dates, date_parser, date_format, thousands, comment, skipfooter, dtype_backend, **kwds)
   1576 def parse(
   1577     self,
   1578     sheet_name: str | int | list[int] | list[str] | None = 0,
   (...)
   1596     **kwds,
   1597 ) -> DataFrame | dict[str, DataFrame] | dict[int, DataFrame]:
   1598     """
   1599     Parse specified sheet(s) into a DataFrame.
   1600
   (...)
   1614     >>> file.parse()  # doctest: +SKIP
   1615     """
-> 1616     return self._reader.parse(
   1617         sheet_name=sheet_name,
   1618         header=header,
   1619         names=names,
   1620         index_col=index_col,
   1621         usecols=usecols,
   1622         converters=converters,
   1623         true_values=true_values,
   1624         false_values=false_values,
   1625         skiprows=skiprows,
   1626         nrows=nrows,
   1627         na_values=na_values,
   1628         parse_dates=parse_dates,
   1629         date_parser=date_parser,
   1630         date_format=date_format,
   1631         thousands=thousands,
   1632         comment=comment,
   1633         skipfooter=skipfooter,
   1634         dtype_backend=dtype_backend,
   1635         **kwds,
   1636     )

File ~\AppData\Local\anaconda3\Lib\site-packages\pandas\io\excel\_base.py:778, in BaseExcelReader.parse(self, sheet_name, header, names, index_col, usecols, dtype, true_values, false_values, skiprows, nrows, na_values, verbose, parse_dates, date_parser, date_format, thousands, decimal, comment, skipfooter, dtype_backend, **kwds)
    775     sheet = self.get_sheet_by_index(asheetname)
    777 file_rows_needed = self._calc_rows(header, index_col, skiprows, nrows)
--> 778 data = self.get_sheet_data(sheet, file_rows_needed)
    779 if hasattr(sheet, "close"):
    780     # pyxlsb opens two TemporaryFiles
    781     sheet.close()

File ~\AppData\Local\anaconda3\Lib\site-packages\pandas\io\excel\_openpyxl.py:615, in OpenpyxlReader.get_sheet_data(self, sheet, file_rows_needed)
    613 data: list[list[Scalar]] = []
    614 last_row_with_data = -1
--> 615 for row_number, row in enumerate(sheet.rows):
    616     converted_row = [self._convert_cell(cell) for cell in row]
    617     while converted_row and converted_row[-1] == "":
    618         # trim trailing empty elements

File ~\AppData\Local\anaconda3\Lib\site-packages\openpyxl\worksheet\_read_only.py:85, in ReadOnlyWorksheet._cells_by_row(self, min_col, min_row, max_col, max_row, values_only)
     77 with self._get_source() as src:
     78     parser = WorkSheetParser(src,
     79                              self._shared_strings,
     80                              data_only=self.parent.data_only,
     81                              epoch=self.parent.epoch,
     82                              date_formats=self.parent._date_formats,
     83                              timedelta_formats=self.parent._timedelta_formats)
---> 85     for idx, row in parser.parse():
     86         if max_row is not None and idx > max_row:
     87             break

File ~\AppData\Local\anaconda3\Lib\site-packages\openpyxl\worksheet\_reader.py:156, in parse()

File ~\AppData\Local\anaconda3\Lib\xml\etree\ElementTree.py:1238, in iterparse.<locals>.iterator(source)
   1236 yield from pullparser.read_events()
   1237 # load event buffer
-> 1238 data = source.read(16 * 1024)
   1239 if not data:
   1240     break

File ~\AppData\Local\anaconda3\Lib\zipfile\__init__.py:989, in ZipExtFile.read(self, n)
    987 self._offset = 0
    988 while n > 0 and not self._eof:
--> 989     data = self._read1(n)
    990     if n < len(data):
    991         self._readbuffer = data

File ~\AppData\Local\anaconda3\Lib\zipfile\__init__.py:1079, in ZipExtFile._read1(self, n)
   1077 if self._left <= 0:
   1078     self._eof = True
-> 1079 self._update_crc(data)
   1080 return data

File ~\AppData\Local\anaconda3\Lib\zipfile\__init__.py:1004, in ZipExtFile._update_crc(self, newdata)
   1001 if self._expected_crc is None:
   1002     # No need to compute the CRC if we don't have a reference value
   1003     return
-> 1004 self._running_crc = crc32(newdata, self._running_crc)
   1005 # Check the CRC if we're at the end of the file
   1006 if self._eof and self._running_crc != self._expected_crc:

KeyboardInterrupt:
#reduce dataframe to only needed columns for easier manipulation and rename columns to match seabass file structure
aqua_match1=aqua_match1[[ 'OrganizationIdentifier','field_flag','tier', 'harmonized_utc', 'harmonized_discrete_depth_value',  'harmonized_value', 'lat','lon']]
aqua_match1=aqua_match1.rename(columns={'OrganizationIdentifier':'station','harmonized_utc':'datetime','harmonized_discrete_depth_value':'depth',
                                      'harmonized_value':'chl','field_flag':'flag'})
aqua_match1['datetime'] = pd.to_datetime(aqua_match1['datetime']) #ensure datetime column is in pandas datetime format and datatype

#for this project, only want data from 2000 thru 2024
aqua_match1 = aqua_match1[(aqua_match1['datetime'] >= pd.to_datetime('2000-01-01 00:00:00').tz_localize('UTC')) & (aqua_match1['datetime'] <= pd.to_datetime('2025-01-01 00:00:00').tz_localize('UTC'))]
To ensure that the metadata was correctly filled out, the station code from the water quality website: https://www.waterqualitydata.us/provider/STORET/ was used to identify the affiliated parties and added to a column of the dataframe
aqua_match1['affiliations']=np.nan
aqua_match1.affiliations[(aqua_match1['station'] =='21FLKWAT') | (aqua_match1['station'] =='21FLKWAT_WQX')] = 'Florida Lakewatch'
aqua_match1.affiliations[(aqua_match1['station'] =='21FLKNMS_WQX')] = 'FLORIDA KEYS NATIONAL MARINE SANCTUARY'
aqua_match1.affiliations[(aqua_match1['station'] =='21FLFMRI')] = 'Florida Fish & Wildlife C C / Marine Research Institute'
aqua_match1.affiliations[(aqua_match1['station'] =='21FLFTM_WQX')] = 'FL Dept. of Environmental Protection, South District'
aqua_match1.affiliations[(aqua_match1['station'] =='21FLDADE_WQX') | (aqua_match1['station'] =='21FLDADE')] = 'Dade Environmental Resource Management'
aqua_match1.affiliations[(aqua_match1['station'] =='21FLBBAP_WQX')] = 'FDEP BISCAYNE BAY AQUATIC PRESERVES'
aqua_match1.affiliations[(aqua_match1['station'] =='21FLCOMI_WQX')] = 'CITY OF MARCO ISLAND'
aqua_match1.affiliations[(aqua_match1['station'] =='21FLBRA')] = 'Biological Research Associates'
aqua_match1.affiliations[(aqua_match1['station'] =='21FLNAPL_WQX')] = 'City of Naples'
aqua_match1.affiliations[(aqua_match1['station'] =='21FLEECO_WQX')] = 'Lee County'
aqua_match1.affiliations[(aqua_match1['station'] =='21FLCHAR_WQX') | (aqua_match1['station'] =='21FLCHAR')] = 'FDEP Charlotte Harbor Aquatic/Buffer Preserves'
aqua_match1.affiliations[(aqua_match1['station'] =='21FLPBCH_WQX') | (aqua_match1['station'] =='21FLPBCH')] = 'Palm Beach County Environmental Resources Managemnt'
aqua_match1.affiliations[(aqua_match1['station'] =='21FLLOX_WQX') | (aqua_match1['station'] =='21FLLOX')] = 'Loxahatchee River District'
aqua_match1.affiliations[(aqua_match1['station'] =='21FLSARA') | (aqua_match1['station'] =='21FLSARA_WQX')] = 'Sarasota County Environmental Services'
aqua_match1.affiliations[(aqua_match1['station'] =='11NPSWRD_WQX')] = 'National Park Service Water Resources Division'
aqua_match1.affiliations[(aqua_match1['station'] =='21FLMANA_WQX') | (aqua_match1['station'] =='21FLMANA')] = 'Manatee County Environmental Management Dept'
aqua_match1.affiliations[(aqua_match1['station'] =='21FLHILL_WQX')] = 'Environmental Protection Commission of Hillsborough County'
aqua_match1.affiliations[(aqua_match1['station'] =='21FLPDEM') | (aqua_match1['station'] =='21FLPDEM_WQX')] = 'Pinellas County Dept. of Environmental Management'
aqua_match1.affiliations[(aqua_match1['station'] =='21FLBSG')] = 'City of Tampa Bay Study Group'
aqua_match1.affiliations[(aqua_match1['station'] =='21FLCOSP_WQX')] = 'City of St Petersburg'
aqua_match1.affiliations[(aqua_match1['station'] =='21FLGW_WQX')] = 'FL Dept. of Environmental Protection'
aqua_match1.affiliations[(aqua_match1['station'] =='21FLCEN_WQX')] = 'Fl Dept. of Environmental Protection, Central District'
aqua_match1.affiliations[(aqua_match1['station'] =='21FLCEN_WQX')] = 'Fl Dept. of Environmental Protection, Central District'
aqua_match1.affiliations[(aqua_match1['station'] =='21FLBREV_WQX') | (aqua_match1['station'] =='21FLBREV')] = 'Brevard County Stormwater Utility Department'
aqua_match1.affiliations[(aqua_match1['station'] =='21FLPCSW') | (aqua_match1['station'] =='21FLPCSW_WQX')] = 'PROJECT COAST - Southwest Florida Water Management District'
aqua_match1.affiliations[(aqua_match1['station'] =='21FLA_WQX')] = 'FL Dept. of Environmental Protection, Northeast District'
aqua_match1.affiliations[(aqua_match1['station'] =='21FLANER') | (aqua_match1['station'] =='21FLANER_WQX')] = 'FDEP APALACHICOLA NATIONAL ESTUARINE RESEARCH RESERVE'
aqua_match1.affiliations[(aqua_match1['station'] =='21FLNWFD')] = 'Northwest Florida Water District'
aqua_match1.affiliations[(aqua_match1['station'] =='21FLPNS_WQX')] = 'FL Dept. of Environmental Protection, Northwest District'
aqua_match1.affiliations[(aqua_match1['station'] =='21FLGTM') | (aqua_match1['station'] =='21FLGTM_WQX')] = 'GUANA TOLOMATO MATANZAS NATIONAL ESTUARINE RESEARCH RESERVE'
aqua_match1.affiliations[(aqua_match1['station'] =='21FLPNS_WQX')] = 'ALABAMA DEPT. OF ENVIRONMENTAL MANAGEMENT'
aqua_match1.affiliations[(aqua_match1['station'] =='21FLPNS_WQX')] = 'National Health and Environmental Effect Research-NHEERL'
aqua_match1.affiliations[(aqua_match1['station'] =='21FLGBO1')] = 'National Health and Environmental Effect Research-NHEERL'
aqua_match1.affiliations[(aqua_match1['station'] =='21FLECUA_WQX')] = 'EMERALD COAST UTLITIES AUTHORITY'
aqua_match1.affiliations[(aqua_match1['station'] =='21FLESC_WQX')] = 'ESCAMBIA COUNTY'
aqua_match1.affiliations[(aqua_match1['station'] =='21FLCBA_WQX') | (aqua_match1['station'] =='21FLCBA')] = 'Choctawhatchee Basin Alliance'
aqua_match1.affiliations[(aqua_match1['station'] =='21FLNUTT_WQX')] = 'NUTTER AND ASSOCIATES'
aqua_match1.affiliations[(aqua_match1['station'] =='21FLCMP_WQX')] = 'FL Dept. of Environmental Protection, OCEC '
aqua_match1.affiliations[(aqua_match1['station'] =='21FLFRYD_WQX')] = 'FRYDENBORG ECOLOGIC LLC'
aqua_match1.affiliations[(aqua_match1['station'] =='21DELAWQ_WQX')] = 'Delaware Dept Natural Resources & Environmental Control'
from the aquamatch metadata file: chl_a workflow, flags are used to check if data is reasonable (flag = 0), suspect (flag = 1), or inconclusive (flag = 2). So remove all bad flags from the dataset.
flag defs from this website:https://portal.edirepository.org/nis/metadataviewer?packageid=edi.1756.2
#Remove bad flags
aqua_match1 = aqua_match1[aqua_match1['flag'] != 1]
aqua_match1 = aqua_match1[aqua_match1['flag'] != 2]
aqua_match1 = aqua_match1[aqua_match1['tier'] != 2]
#only want points above 150 meters for algorithm development
aqua_match1 = aqua_match1[aqua_match1['depth'] <=150]

#while the aquamatch doi mentions HPLC, it seems like the flags for if the CHL sample was HPLC or not is buried in the metadata and not saved
# to this dataset, and so there is no definitive way of distinguishing HPLC from non HPLC. Therefore, assume no HPLC
aqua_match1['HPLC']=1
#triplicate flag
counts_series = aqua_match1[['depth','datetime','lat','lon']].value_counts() #count how many unique depth, datetime, lat, and lons there are
counts_df = counts_series.reset_index(name='freq_uniq') #create new column where each unique entry aso shows howmany times that entry was recorded
aqua_match1 = pd.merge(aqua_match1, counts_df, on=['depth','datetime','lat','lon'], how='left') #add frequency column to original dataframe

#sometimes, triplicate specific times are recorded (ex: 3:00, 3:05, 3:10 ), so also check for unique datehour entries
aqua_match1['date_hour'] = aqua_match1['datetime'].dt.strftime('%Y-%m-%d %H')
counts_series = aqua_match1[['depth','date_hour','lat','lon']].value_counts() #count how many unique datehour, lat, and lons there are
counts_df = counts_series.reset_index(name='freq_hour')
aqua_match1 = pd.merge(aqua_match1, counts_df, on=['depth','date_hour','lat','lon'], how='left') #add frequency column to original dataframe

aqua_match1['triplicate'] = 1 #assume bad unless otherwise said
aqua_match1.loc[aqua_match1['freq_uniq'] == 3, 'triplicate'] = 0 #if there are exactly 3 unique datetime, lat, and lons, assume triplicate
aqua_match1.loc[(aqua_match1['freq_uniq'] == 1) &(aqua_match1['freq_hour'] == 3), 'triplicate'] = 0 #if 1 unique datetime BUT 3 unique date_hours, assume triplicate

#reduce columns to only needed ones
aqua_match1=aqua_match1[['station', 'datetime', 'depth','chl', 'lat', 'lon', 'affiliations','HPLC','triplicate']].reset_index(drop=True)
aqua_match1['source']='AquaMatch'
aqua_match1['investigators']= 'Brousil, Matthew R'
aqua_match1['url']='https://doi.org/10.6073/pasta/2f750544112e5408928dd9a61e6ace30'
aqua_match1['datetime'] = aqua_match1['datetime'].dt.tz_localize(None)
Congrats on having all coastal chlorophyll data from aquamatch!!
Ross, M. R. V., Topp, S. N., Appling, A. P., Yang, X., Kuhn, C., Butman, D. et al. (2019). AquaSat: A data set to enable remote sensing of water quality for inland waters. Water Resources Research, 55, 10012–10025. https://doi.org/10.1029/2019WR024883
Plots#
aqua = pd.read_excel(r'C:\Users\gianna.milton\Documents\Python\Coastal_chl_final\aquamatch_chl_na.xlsx')
year_test=aqua.copy()
year_test['datetime'] = pd.to_datetime(year_test['datetime'])
year_test['year'] = year_test['datetime'].dt.year
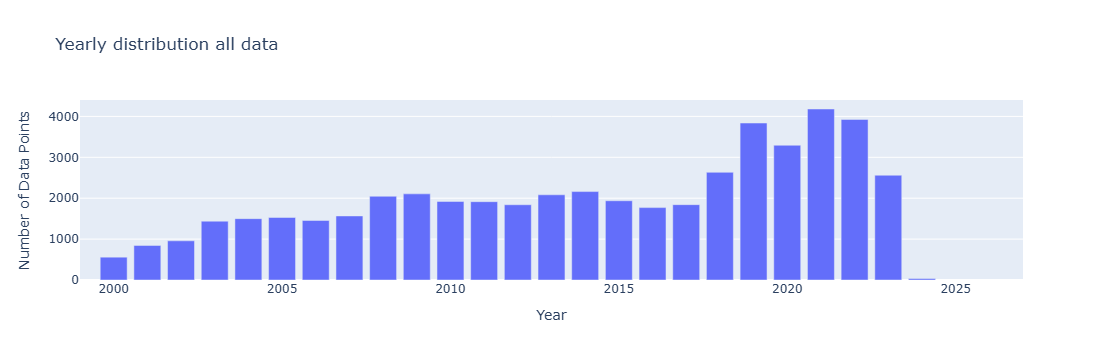
grouped = year_test.groupby(['year']).size().reset_index(name='DataPoints')

# Create bar chart
fig = px.bar(grouped,x='year', y='DataPoints', title='Yearly distribution all data',
             labels={'year': 'Year', 'DataPoints': 'Number of Data Points', 'metadata': 'Metadata'},)
fig.update_xaxes(range=[1999,2027])
fig.update_layout(barmode='stack')  # ensures stacking
fig.show()
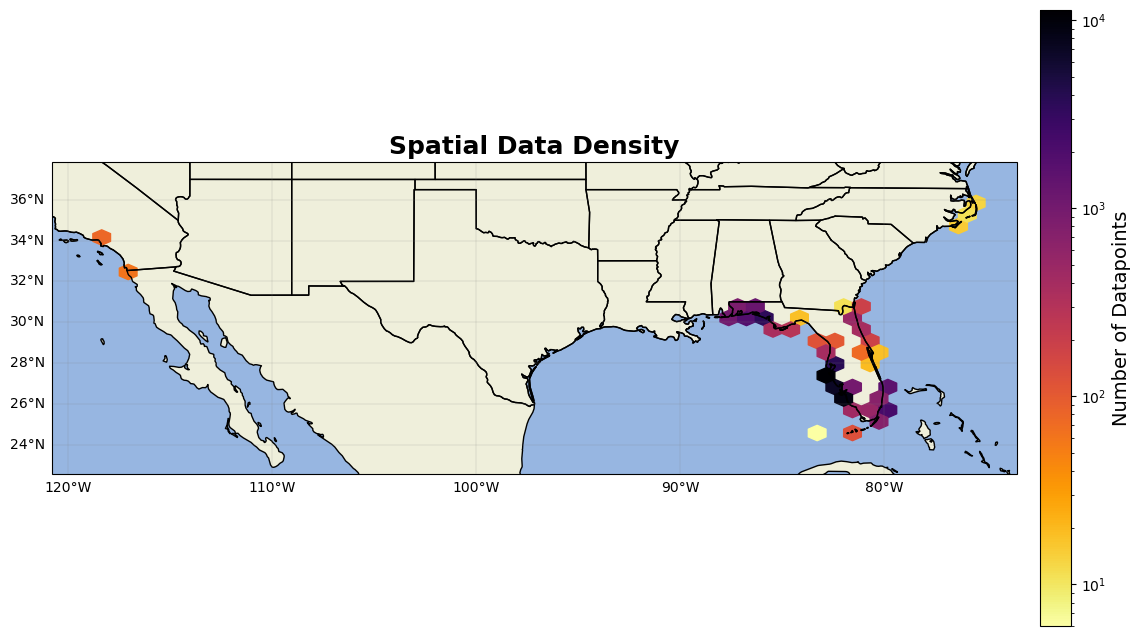
from matplotlib.colors import LogNorm # Important for high-variance data
fig = plt.figure(figsize=(15, 10))
ax = fig.add_subplot(1, 1, 1, projection=ccrs.PlateCarree())
ax.add_feature(cfeature.LAND)
ax.add_feature(cfeature.OCEAN)
ax.add_feature(cfeature.COASTLINE)
ax.add_feature(cfeature.BORDERS)
ax.add_feature(cfeature.STATES)
hb = ax.hexbin(year_test.lon, year_test.lat, gridsize=(50,10), cmap='inferno_r', mincnt=1, transform=ccrs.PlateCarree(),norm=LogNorm())
cb = plt.colorbar(hb, ax=ax, orientation='vertical', pad=0.02, shrink=0.8)
cb.set_label('Number of Datapoints', fontsize=14)
gl=ax.gridlines(linewidth=0.2,color='grey',alpha=0.7,linestyle='-', draw_labels=True, x_inline= False,y_inline=False)
gl.xformatter=LONGITUDE_FORMATTER
gl.yformatter=LATITUDE_FORMATTER
gl.top_labels = False    # Disable top labels
gl.right_labels = False  # Disable right labels
ax.set_xlim(min(year_test.lon)-2,max(year_test.lon)+2)
ax.set_ylim(min(year_test.lat)-2,max(year_test.lat)+2)

ax.set_title('Spatial Data Density', fontsize=18, fontweight='bold')

plt.show()